
This example describes a typical pipeline consisting of data clustering, generating heatmap and its integration into the web page.
InCHlib does not perform hierarchical clustering by itself. It is a visualization library to which data must be supplied in the JSON compliant InCHlib format. This format is readily produced by our Python clustering tool inchlib_clust. However, the user can use an arbitrary clustering software provided that a valid InCHlib input file is generated.
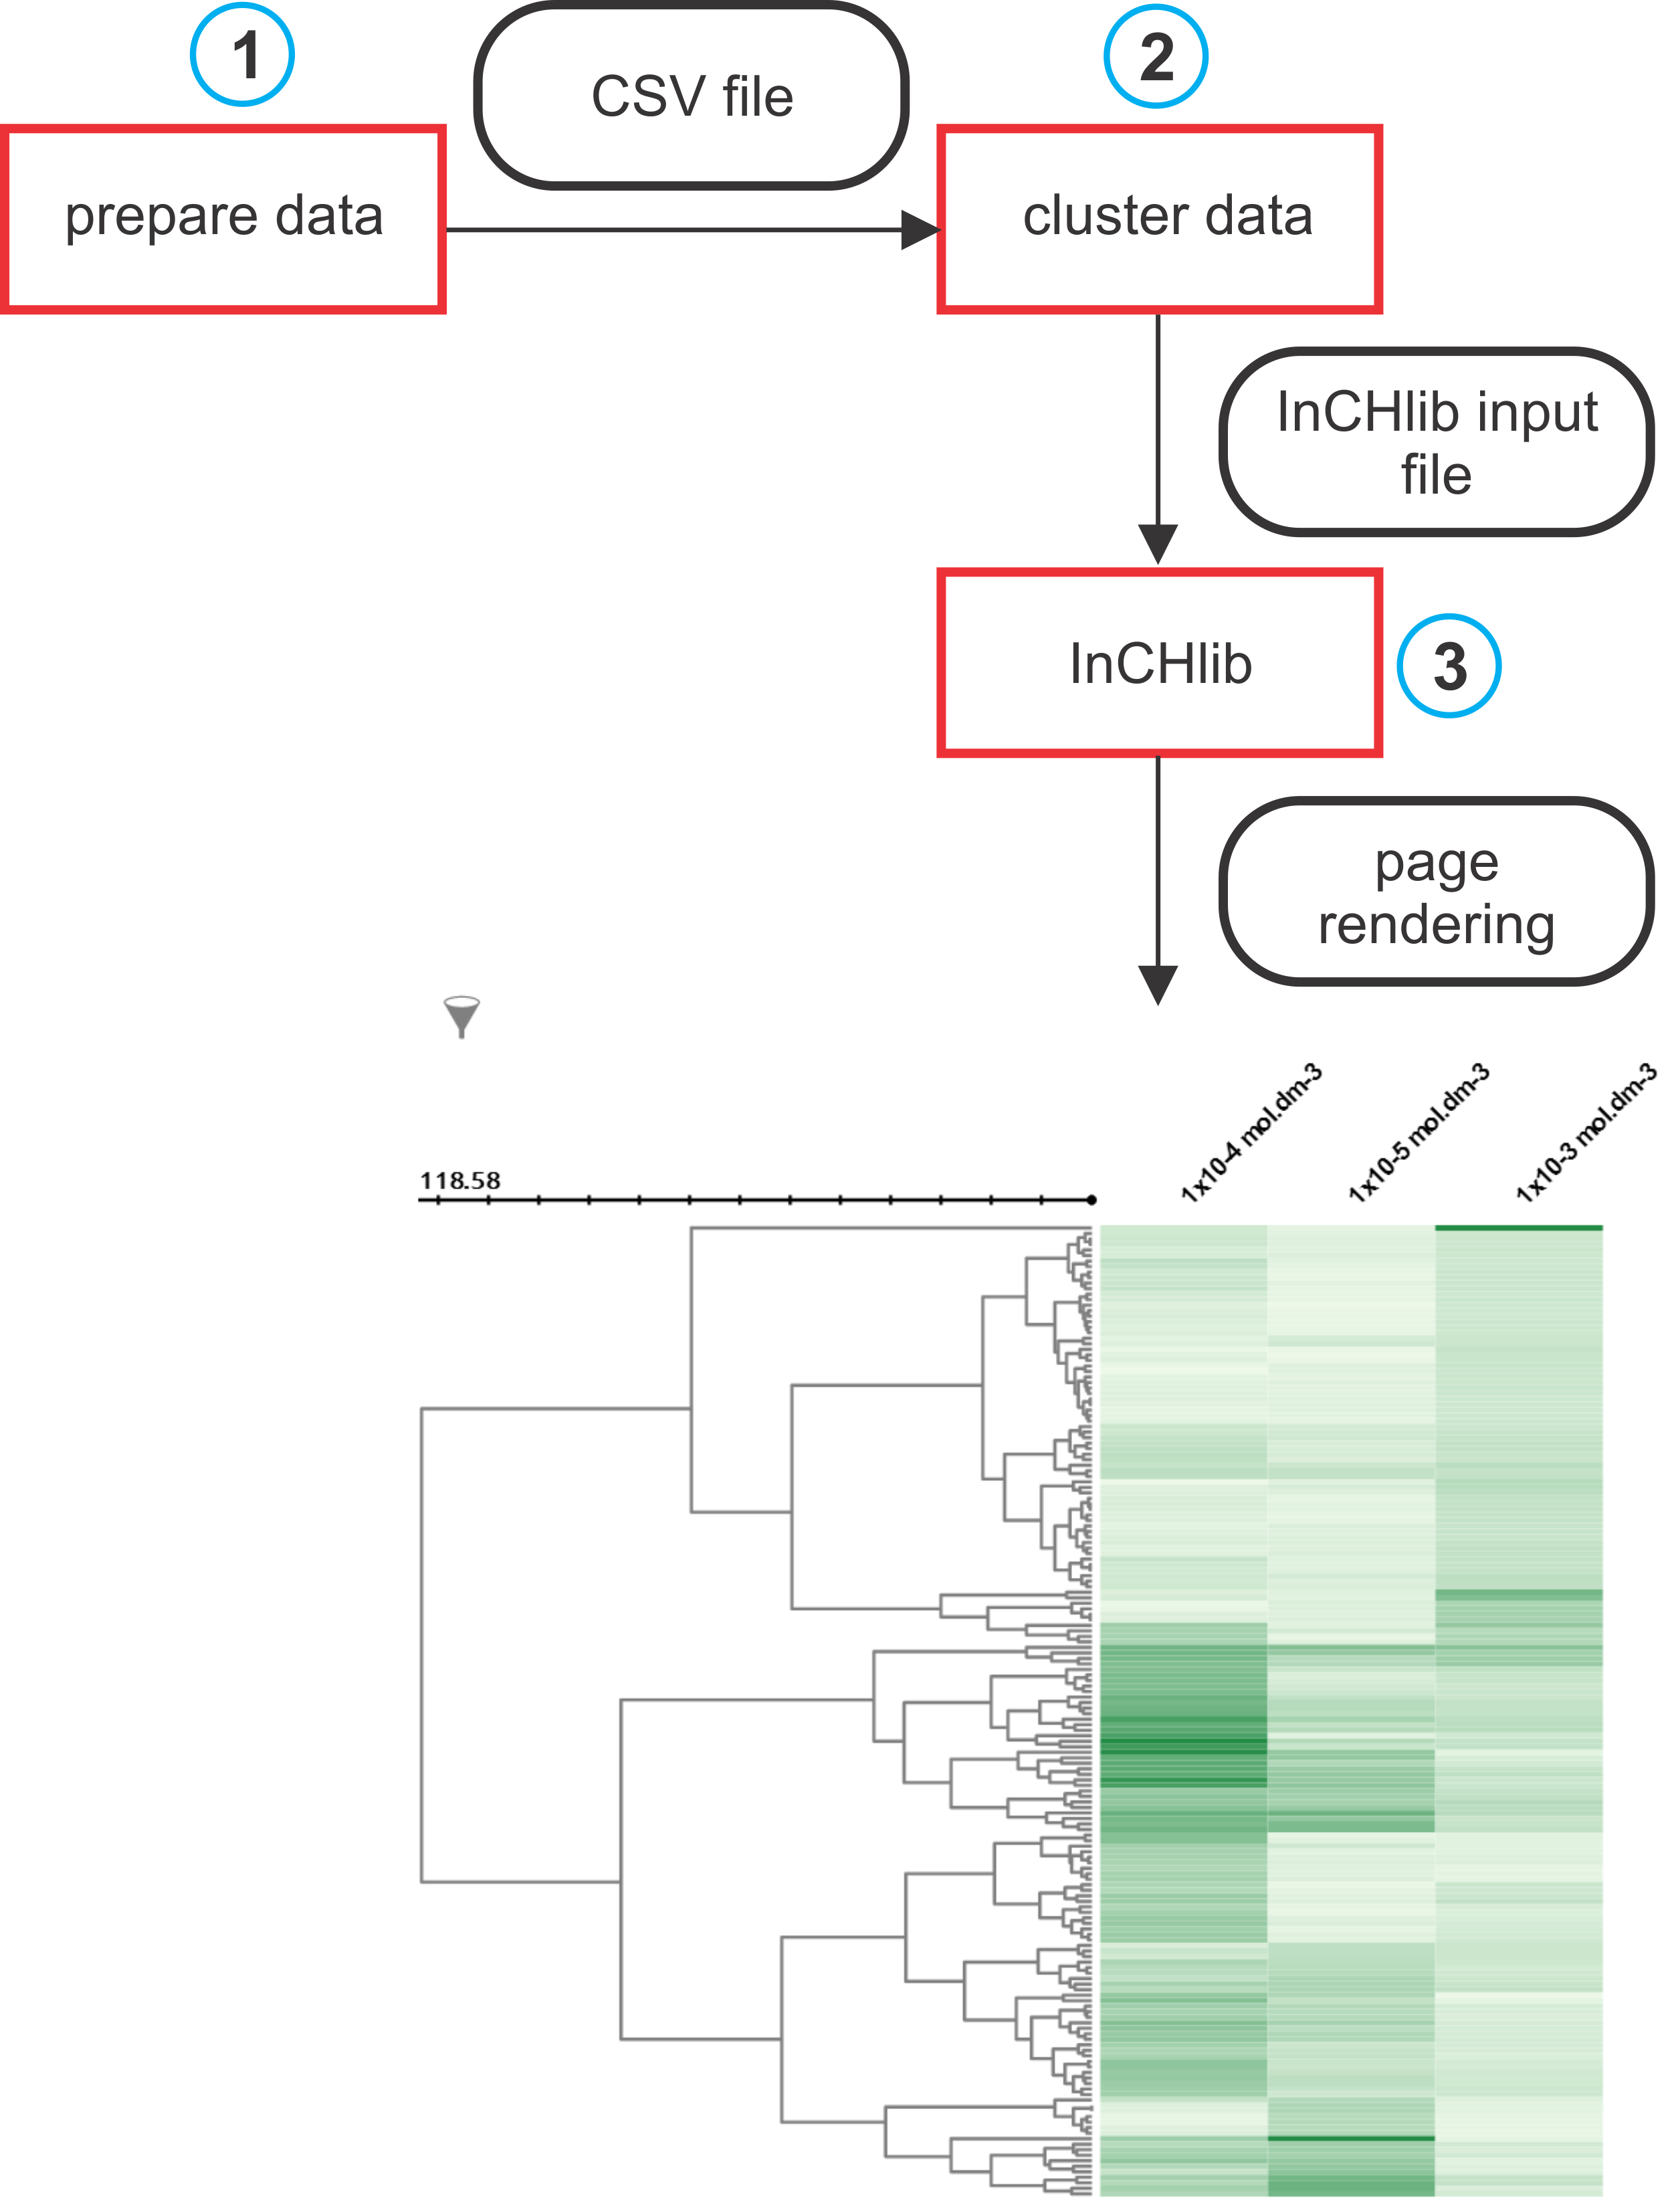
Typical data processing and visualization pipeline is shown in the figure below. Individual steps (blue circles) are further described in a more detail.
Data for clustering are typically supplied to inchlib_clust as a csv (comma separated values) file. If the user wants to have column headers displayed in the heatmap, the first row of a csv file must contain header names. Row and column metadata are provided in a separate csv files. The first column of both data and row metadata files is always taken as an ID column. Below are given example snippets of data and row/column metadata files used in all tutorial examples. They represent the activities of several ligands measured at three different concentrations with three physico-chemical properties as row metadata and three measurement properties as column metadata.
Recommended way of data clustering is the use of the inchlib_clust script. This script not only performs clustering, but also returns the cluster heatmap as an InCHlib input file. Below given is the command-line for Ward’s clustering with the Euclidean distance (these two options are implicit) of data stored in the example_data.csv file. Row metadata are provided (option -m) as the example_metadata.csv file and column metadata (option -cm) as the example_column_metadata.csv file. Data as well as row metadata files have column headers (-dh and -mh options). Column metadata has 'header' (labels) in the first column (-cmh option). The output file example.json contains the cluster heatmap in the InCHlib input format.
The file example.json describes dendrogram structure and it contains all data necessary for cluster heatmap visualization. No other file is needed to render the cluster heatmap. An example below demonstrates how easy it is to integrate InCHlib visualization into your web page.
inchlib.js (and its dependencies jquery-2.0.3.min.js and kinetic-v5.1.0.min.js) must be first imported in the <script> tag. InCHlib is initialized immediately when the whole page is loaded (detected by the $(document).ready event), and it contains several attributes defining the appearance of the visualization (all attributes are documented here). Finally, example.json is loaded, and the cluster heatmap is displayed.
Below is an example of a simple HTML web page with InCHlib integration:
You can see the resulted web page here >>
Simple HTML page with embedded cluster heatmap can also be exported by inchlib_clust using the export_cluster_heatmap_as_html() function (-html /path/to/dir in command-line). All files including dependencies are stored to the user defined directory. If the user does not provide the directory path, the current directory is used.